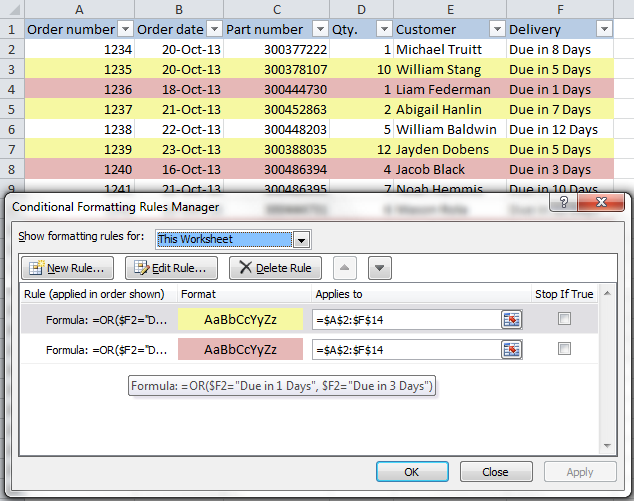
Have you ever wished your spreadsheets could be more visually appealing and insightful? Imagine highlighting rows with specific criteria, instantly drawing attention to crucial data points. This is where conditional formatting comes in, a powerful tool that lets you automatically change row colors based on cell values. This dynamic feature transforms your spreadsheets from static data displays to interactive and visually engaging dashboards.

Image: www.heelpbook.net
Whether you’re a seasoned data analyst or a casual spreadsheet user, mastering conditional formatting can significantly enhance your data analysis and presentation skills. In this comprehensive guide, we’ll dive deep into the “change row color based on cell value” technique, exploring its functionalities, applications, and best practices. By the end, you’ll be equipped to transform your spreadsheets into intuitive and impactful visual representations of your data.
Understanding Conditional Formatting: The Essence of Dynamic Visuals
Conditional formatting is a spreadsheet feature that allows cells to change appearance based on specific criteria. This dynamic formatting revolutionizes how we interact with data, turning passive spreadsheets into active visual tools. By applying conditional formatting rules, you can automatically highlight cells based on values, dates, text, or even comparisons.
The Power of Visual Cues: Why Change Row Colors?
Imagine sifting through a massive spreadsheet filled with rows of numbers. Finding a specific value or pattern would feel like searching for a needle in a haystack. Now visualize your data organized visually, with rows changing colors based on predetermined criteria. Instantly you know where to focus, spotting trends and outliers effortlessly.
Here are some key benefits of changing row colors based on cell values:
- Instant Data Insights: Visually identify critical data points without manually searching.
- Enhanced Data Analysis: Quickly spot trends, outliers, and patterns within your data.
- Improved Communication: Convey data insights more effectively through visual representations.
- Increased Productivity: Simplify data analysis tasks by efficiently identifying relevant data.
Navigating the Options: How to Change Row Colors
Different spreadsheet software offers variations on conditional formatting functionalities. While the underlying principles remain the same, the specific steps may vary. This guide will outline general steps for applying conditional formatting rules to change row colors based on cell values.

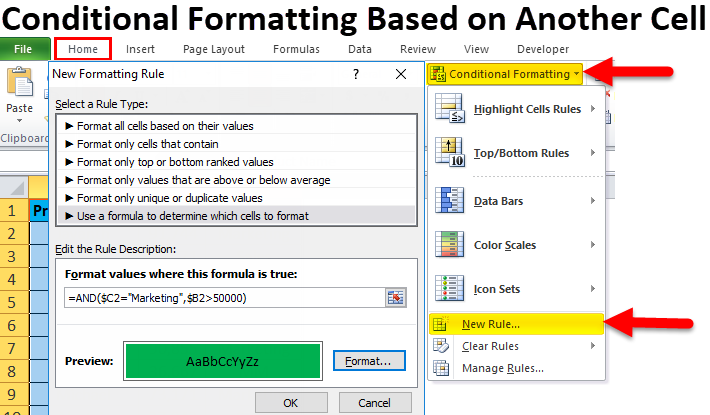
Image: texte.rondi.club
Step 1: Selecting Your Target Range
Begin by selecting the entire range of rows you want to apply conditional formatting to. This is your canvas – the area where you want row colors to change based on cell values.
Step 2: Accessing the Conditional Formatting Menu
Each spreadsheet software has a dedicated menu or toolbar for conditional formatting. Look for a button or icon labeled “Conditional Formatting.” Depending on your software, you might find it under “Home,” “Format,” or “Styles.”
Step 3: Defining Your Rules
This is where the real magic happens – creating the rules that determine when row colors change. Most spreadsheet software offers a variety of conditional formatting options. Here’s a breakdown of common options:
- Highlight Cells Rules: This option offers pre-built rules for frequently used conditional formatting scenarios, such as highlighting values above or below a threshold, duplicate values, and more.
- Format Only Cells that Contain: This option allows you to create custom rules based on specific criteria. You can choose to target cells that contain certain text, specific values, or even blank cells.
- Format Cells that are: This option focuses on formatting based on the cell’s properties, such as its value type (numeric, text, date), or its location within the spreadsheet.
- Use a Formula to Determine Which Cells to Format: This advanced option empowers you to create complex custom rules by defining a formula that determines which cells should be formatted.
Creating Your First Conditional Formatting Rule: A Hands-On Example
Let’s walk through a practical example of applying conditional formatting rules to change row colors based on sales data. Imagine you have a spreadsheet listing customer names, purchase dates, and sales amounts. You want to instantly identify customers with sales exceeding $500.
1. Select the Target Range:
Select the entire range of rows containing the sales data. This ensures that all rows will be affected by the conditional formatting rule.
2. Access the Conditional Formatting Menu:
Locate the conditional formatting menu within your spreadsheet software and click on it.
3. Define Your Rule:
Choose the “Highlight Cells Rules” option and select “Greater Than.” This rule will highlight rows where the sales amount exceeds a specified threshold.
4. Specify the Threshold:
Enter “$500” in the “Value” field. This sets the threshold for highlighting rows with sales exceeding $500.
5. Choose a Format:
Select a desired format for highlighted rows. Choose a color that stands out from the rest of the spreadsheet, making high-value customers visually apparent.
6. Apply the Rule:
Click “OK” to apply the rule. Now, all rows with sales figures greater than $500 will be automatically highlighted with your chosen color.
Advanced Techniques: Expanding Your Conditional Formatting Options
As you become more familiar with conditional formatting, you can explore more advanced techniques to create even more dynamic and intricate visualizations. Here’s a glimpse of some additional options:
1. Applying Multiple Rules:
You’re not limited to just one conditional formatting rule per spreadsheet. You can apply multiple rules to highlight different aspects of your data, creating a multi-layered visual representation. For instance, you could create one rule to highlight sales exceeding $500, and another to highlight sales below $100, visually defining different performance tiers.
2. Using Custom Formulas:
For truly complex scenarios, you can create custom formulas that determine how cell values affect row colors. This gives you incredible control over the formatting. For example, you could create a formula to highlight rows where the customer’s total sales exceed their average purchase amount by a certain percentage, highlighting customers with a significant growth in spending.
3. Dynamic Formatting:
Some spreadsheets allow you to make your conditional formatting rules dynamic. Imagine if you could automatically change row colors based on a dynamic reference, like a cell containing the current month. This creates a live updating spreadsheet that reflects changing data points in real-time.
Real-World Applications: Conditional Formatting in Action
Conditional formatting is a versatile tool with widespread applications across various industries and tasks. Here are a few examples of how changing row colors can significantly enhance data analysis and communication:
Finance:
Highlighting transactions exceeding a specific threshold, indicating potential fraudulent activity or large investment opportunities. Categorizing accounts based on their financial performance, using different colors to represent profitable, declining, and neutral accounts.
Sales:
Identifying top-performing sales representatives based on sales figures, highlighting their rows to recognize their achievements. Monitoring customer activity, changing row colors based on order frequency, purchase value, or last purchase date, guiding sales efforts and customer relationship management.
Marketing:
Analyzing campaign effectiveness, changing row colors based on conversion rates or click-through rates, identifying successful campaigns for optimization. Segmenting customer profiles based on demographics, interests, or behavior, highlighting relevant rows for targeted marketing efforts.
Project Management:
Visualizing project timelines, highlighting tasks nearing deadlines or those exceeding budget limits, facilitating better project planning and risk management. Tracking project progress, using colors to represent task completion status, providing a visual overview of project health and progress.
Human Resources:
Identifying high-performing employees based on performance reviews, highlighting their rows for recognition and talent management. Analyzing employee demographics and diversity, using colors to highlight different groups for diversity initiatives and workforce planning.
The Future of Conditional Formatting: Trends and Developments
As spreadsheet software evolves, so too do conditional formatting capabilities. Here are some exciting trends and developments to watch out for:
1. Advanced Visualization Options:
Expect more advanced visualization options within conditional formatting. Imagine dynamically changing row colors not only based on cell values but also on data trends, correlations, and other advanced data analytics insights. This will elevate spreadsheets into powerful data visualization dashboards.
2. Enhanced Interactivity:
Conditional formatting is becoming more interactive. You might see dynamic changes in row colors based on user input or even real-time data feeds. This could open up new avenues for data exploration and collaboration.
3. Integration with Other Tools:
Conditional formatting is likely to seamlessly integrate with other data visualization and analytics tools. This will create a holistic data analysis ecosystem where conditional formatting plays a vital role in presenting complex data insights effectively.
Change Row Color Based On Cell Value
Conclusion: Embracing the Power of Conditional Formatting
In this era of information overload, clear visual communication is more important than ever. Changing row colors based on cell values is a simple yet powerful technique that unlocks the full potential of your spreadsheets. By leveraging conditional formatting, you can transform your data into actionable insights, enhance your data analysis, and communicate your findings with clarity and impact. So, embrace the power of conditional formatting, unleash the visual intelligence in your spreadsheets, and make your data sing.


